events displays corporate and market events — earnings, dividends, splits and
news — as small badges below the candle area, aligned to the candle nearest each
event's time. Badges indicate when an event occurred without obscuring price.
KChartWidget(
  candles,
  ChartColors(),
  timeFrame: const Duration(days: 1),
  events: [
    ChartEvent(time: reportedAt, kind: ChartEventKind.earnings),
    ChartEvent(
      time: exDate,
      kind: ChartEventKind.dividend,
      detail: r'$0.24 per share',
    ),
    ChartEvent(time: splitAt, kind: ChartEventKind.split, label: '4:1'),
    ChartEvent(time: headlineAt, kind: ChartEventKind.news),
  ],
  onEventTapped: (event) => showAboutEvent(event),
);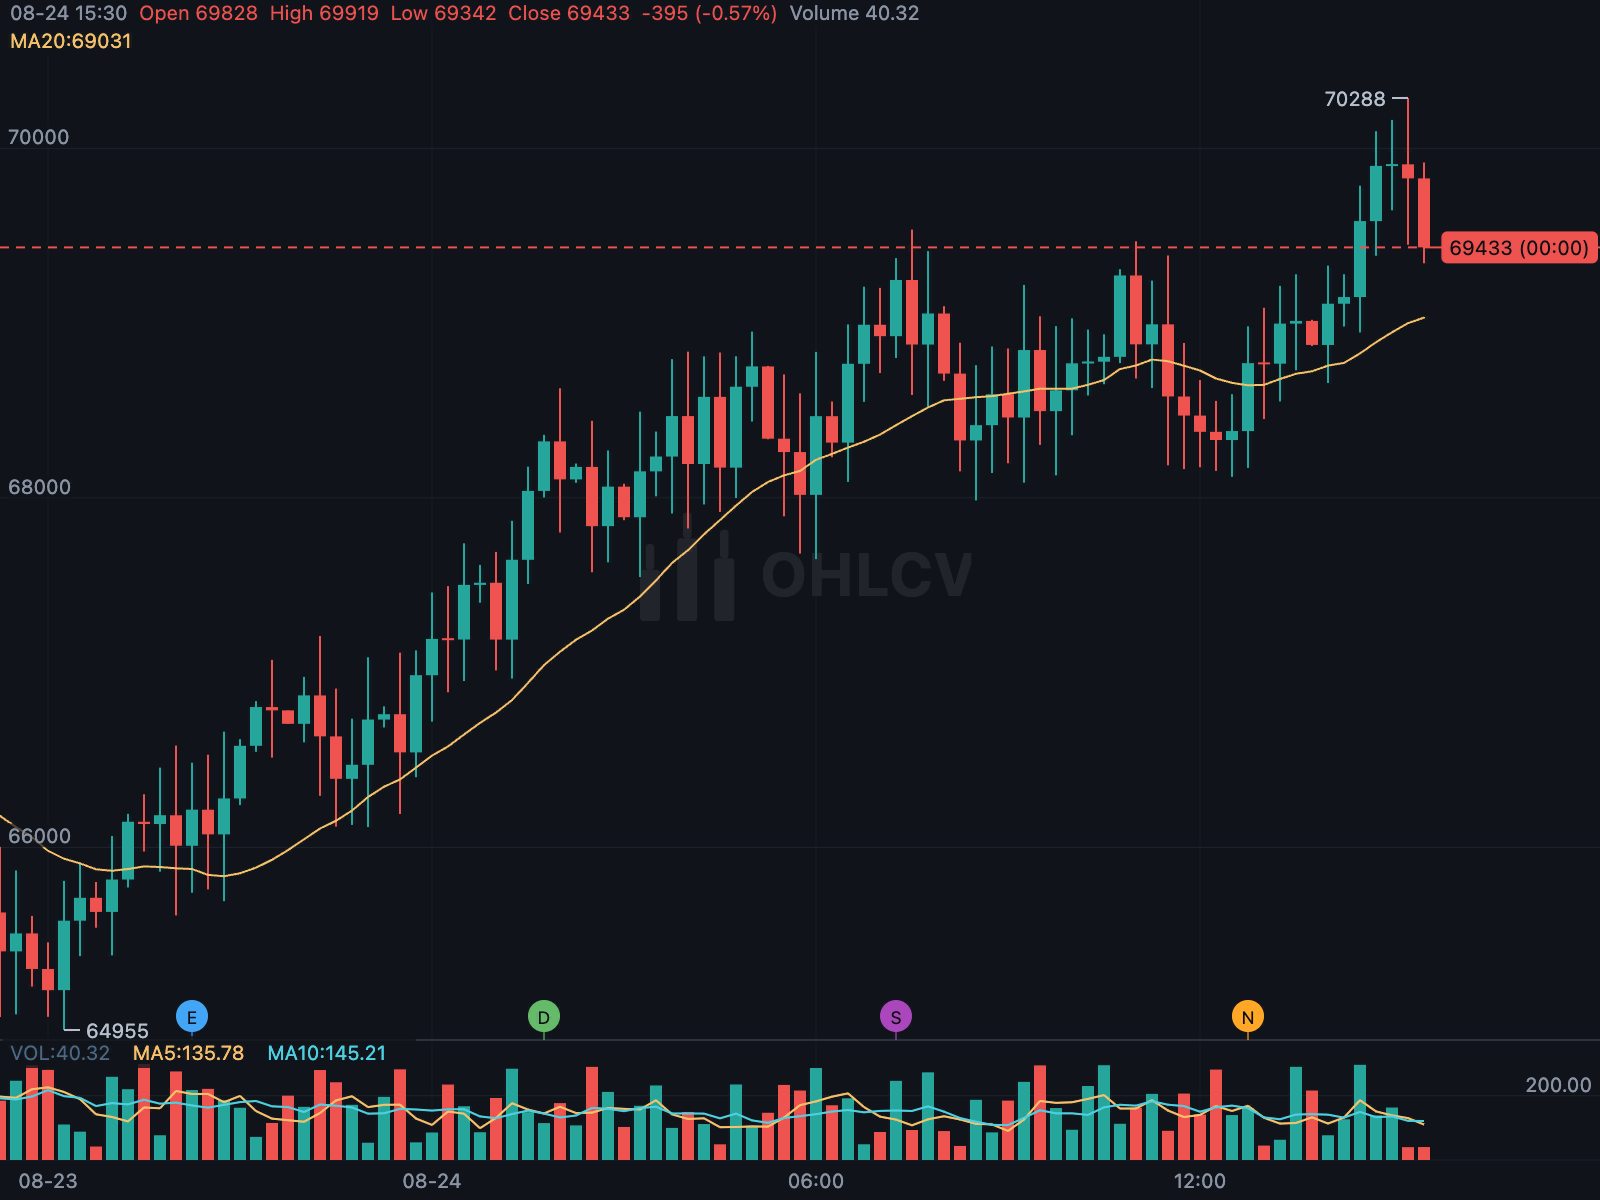
| Kind | Default label |
|---|---|
ChartEventKind.earnings |
E |
ChartEventKind.dividend |
D |
ChartEventKind.split |
S |
ChartEventKind.news |
N |
ChartEventKind.custom |
• |
Default colours come from ChartColors.eventColors. Override them per event with
label, color and icon. detail is not rendered on the chart; use it in
your own panels or tooltips.
onEventTappedreports taps on a badge. Badge taps take priority over selection and drawing input.ChartStyle.eventMarkRadiussets the badge size andeventMarkGapthe distance below the candles. A radius of0hides the badges while keeping event data available.resolveEventsmaps events to candle indices without a chart instance.