

English guide · Русский · 简体中文 · What's new in 2.2
Reproducible synthetic OHLCV scenarios for trading-system tests and quantitative research. The v2 API separates generation, validation, diagnostics, CSV, replay and charts. It produces synthetic test data; it does not forecast markets or establish that a strategy is profitable.
PriceGenerator 2.2 supports CPython 3.10–3.15.
python -m pip install pricegenerator==2.2.0
python -m pip install 'pricegenerator[export]==2.2.0'  # Optional PNG/JPEG.
To work from a source checkout, run python -m pip install ..
See what's new in 2.2 or
find earlier builds on GitHub.
from pricegenerator import Generate, GenerationConfig, ReadCSV, WriteCSV

config = GenerationConfig(seed=0, horizon=240, volatility=0.01)
prices = Generate(config)
WriteCSV(prices, "prices.csv")
restored = ReadCSV("prices.csv")
GenerationConfig is immutable. Defaults include a fixed UTC start and the
versioned regime_v3 model with whole synthetic volume counts. Seed zero is valid. Generation owns a private RNG
and leaves process-global random state alone. See model semantics and the 1.4.93 comparison.
Use model="regime_v2" for prior continuous-volume scenarios.
Canonical data has exactly datetime, open, high, low, close, volume: UTC
nanosecond timestamps and finite float64 values. Fractional imported
trade quantities retain their original values. Imported naive timestamps need
an explicit timezone. ValidateOHLCV returns detached canonical data and can
check cadence/gaps. Structural validity is separate from empirical market fit.
import json
from pricegenerator import Analyze, Chart, CreateManifest, Indicators, Replay

manifest = CreateManifest(config, prices)
with open("scenario.json", "w", encoding="utf-8") as stream:
    json.dump(manifest, stream, allow_nan=False, indent=2)
replayed = Replay(manifest)
statistics = Analyze(prices).ToDict()
indicators = Indicators(prices).ToDict()
chart_path = Chart(prices, "chart.html", analysis=True, view=False)
A manifest records full configuration, model/RNG/library identity, environment
and separate scenario-identity and canonical-output fingerprints. Replay requires
a matching environment by default; strict_environment=False still requires exact fingerprint equality.
Diagnostics and indicators do not mutate source data. Missing/domain-limited
estimates include reasons, rather than fabricated finite values.
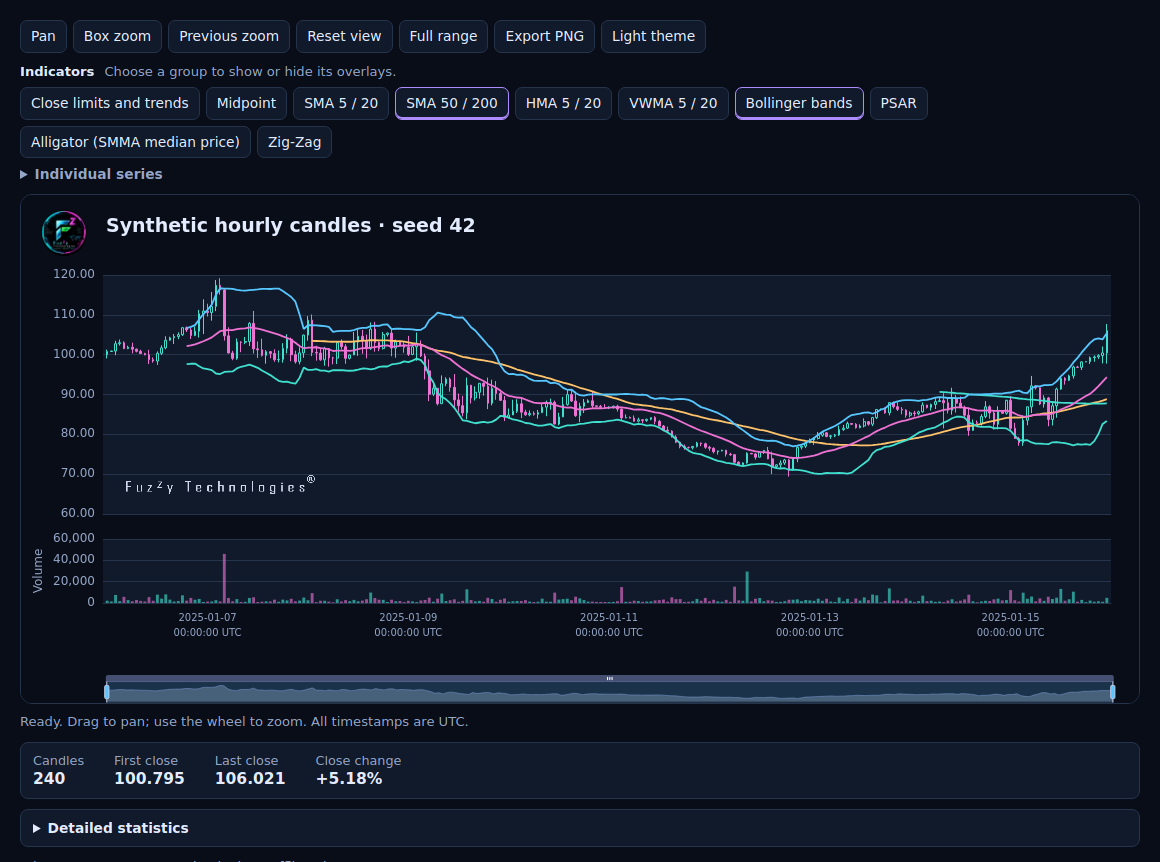
Chart(prices) creates offline interactive HTML and opens it in the browser.
Use view=False in batch jobs. SVG needs an explicit .svg destination; PNG and
JPEG additionally need [export]. analysis=True explicitly attaches financial
overlays and diagnostics. DisplayChart(prices) embeds HTML in a notebook;
install .[notebook] if the host lacks notebook tooling. Charts contain one
translucent corporate wordmark in the price panel. See chart guide.
pricegenerator generate --seed 0 --horizon 240 --output prices.csv --manifest scenario.json
pricegenerator replay scenario.json --output replay.csv
pricegenerator validate prices.csv --timeframe-seconds 3600 --no-gaps
pricegenerator analyze prices.csv --output statistics.json
pricegenerator chart prices.csv --output chart.html --no-view --analysis
Want indicator buttons? Rebuild the HTML from the same CSV with
--analysis (or use Chart(prices, "chart.html", analysis=True) in Python).
Open the HTML in your browser. Click Bollinger bands to see the price
envelope, SMA 50 / 200 to compare moving averages, or Midpoint to mark
the middle of each candle's high–low range. Other groups include HMA, VWMA,
PSAR, Alligator and Zig-Zag. Expand Individual series to toggle one line
at a time. SMA 200 needs at least 200 candles.
Use the wheel or Box zoom to focus on an interval. Switch to Light theme if you prefer, or download the current view with Export PNG. The brief overview sits below the chart. Expand Detailed statistics for the full report.
Version 2.1 also provides ensemble generation and exact replay through the CLI and Python, and optional fuzzy regime diagnostics on Python 3.13–3.15.
python -m pricegenerator exposes the same commands. A JSON --config supplies
all generation parameters; explicit common CLI flags override those fields.
Unknown fields, nonfinite values, ambiguous times and aliased input/output paths
fail early. The old mutable class, rendering methods and old CLI flags are
removed; migration and ADR-0010
record the deliberate break. Historical evidence remains archived.
In 2.2, compare two OHLCV CSVs at an explicit bar interval, or use the experiment bundle to generate two seeded fixtures. The example verifies single-path and ensemble replay and records a comparison, an offline quantile chart and checksums.
python -m pip install -r requirements.txt
python -m pytest -q tests
Start with development commands, packaging
and the ADRs. AI contributors: read AGENTS.md
before changing code, then follow the linked protocol and style contract.
Research helpers remain experimental and module-qualified under
pricegenerator.calibration, pricegenerator.evaluation,
pricegenerator.extended_models and pricegenerator.registry; they are outside
the compact root API and do not imply validation against every real market.
Large-data adapters are GenerateChunks and WriteCSVChunks.